Over the past few months, many of our clients running out-of-home have been concerned about a drop in impression levels with out-of-home advertising due to COVID-19. We have been closely monitoring this via our out-of-home subscriber-based software to determine if out-of-home advertising should remain part of our client’s overall media strategy. This software leverages opt-in location data captured daily by two of the largest mobile geolocation data providers. The device data is weighted against current year population. In California, they can obtain minute to minute traffic counts via Caltrans.
Although in March and April, we saw impressions levels drop to as low as 50% in some markets, traffic has continuously increased throughout May & June. Below is an Impression Variation report with the data for May 4th-June 8th, for geographic markets important to our clients. However, we can pull any market and/or time-period requested.
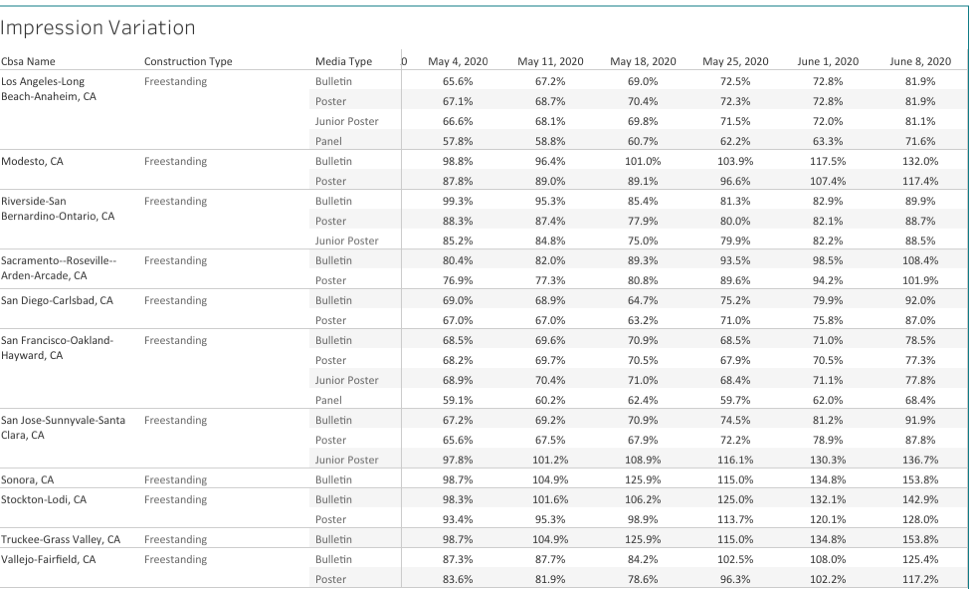
The chart shows the impression variation each week compared to original 2020 forecasted levels.
Example 1: In Los Angeles-Long Beach-Anaheim, impressions were at 65% for the week of May 4th. Compared to the forecast, they were down 35%. For the week of June 8th, they are at 81.9% so they were only down 18% of forecasted impressions. In some markets, impressions are above the forecasted impressions.
Example 2: In Vallejo-Fairfield impressions are at 125% for the week of June 8th compared to the forecast. For all markets above, for week of June 8th, overall impressions were at 102% of forecasted impressions.
Based on the information that impressions are surpassing (or almost at) what they were projected, out-of-home media should remain an integral part of 2020 media campaigns.
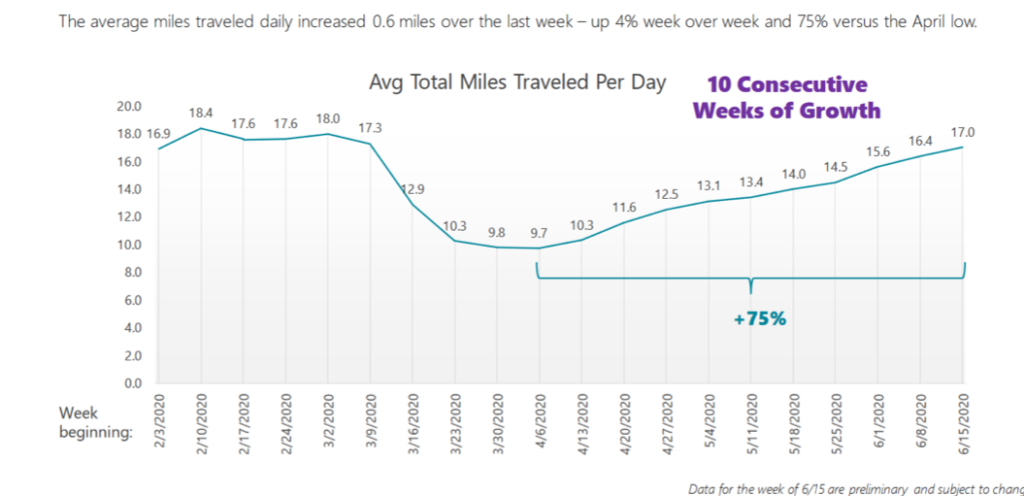
In addition to Impressions Variation report, we also can pull/receive reports on travel patterns across the US by state and by count. The report below shows the increase in miles traveled by week from February thru mid-June. You can see that average total miles traveled per day is almost back to pre-stay-at-home time periods. And most important, there have been 10 consecutive weeks of growth, up 75%.